In my last blog post, I talked about how too much focus on ROI could not only stifle creativity, morale and initiative, but could also give companies a false sense of which elements in their marketing mix were most effective and which weren’t making the grade. This is because every item in your marketing mix is linked; none stand alone and they all interact and reinforce one another. As Wes Nichols wrote in the March 2013 issue of the Harvard Business Review,
“…outmoded methods have lulled many marketers into complacency. They mistakenly think they have a handle on how their advertising actually affects behavior and drives revenue. But that approach is backward-looking: It largely treats advertising touch points—in-store and online display ads, TV, radio, direct mail, and so on—as if each works in isolation.”
As an example, Nichols adds,
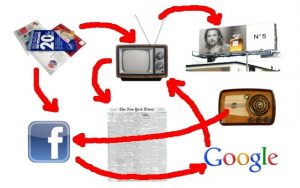
“Today’s consumers are exposed to an expanding, fragmented array of marketing touch points across media and sales channels. Imagine that while viewing a TV spot for a Toyota Camry, a consumer uses her mobile device to Google “sedans.” Up pops a paid search link for Camry, as well as car reviews. She clicks through to Car and Driver’s website to read some reviews, and while perusing, she notices a display ad from a local dealership but doesn’t click on it. One review contains a link to YouTube videos people have made about their Camry’s. On YouTube she also watches Toyota’s clever “Camry Reinvented” Super Bowl ad from eight months earlier. During her commute to work that week she sees a Toyota billboard she hadn’t noticed before and then receives a direct-mail piece from the company offering a time-limited deal. She visits local dealerships’ websites, including those promoted on Car and Driver and in the direct-mail piece, and at last heads to a dealer, where she test-drives the car and buys it.”
The Marketing Mix
How does a marketer measure the impact of all of these moving, interlocking pieces? Nichols recommends three steps:
1. Attribution. Companies gather data across five areas: market conditions, competitive activities, marketing actions, consumer response, and business outcomes. Detailed analysis determines “assist rates.” Says Nichols, “An analysis could pick up a spike in consumers’ click-throughs on an online banner ad after a new TV spot goes live—and link that effect to changes in purchase patterns. This would capture the spot’s “assist” to the banner ad and provide a truer picture of the TV ad’s ROI.”
2. Optimization. Companies “war game” or use simulations to determine the impacts of changes in the allocation of marketing resources. Every marketing initiative is assigned an “elasticity” factor or how much a particular marketing effort affects another. This allows the company to be predictive in its advertising.
3. Allocation. Rather than creating a marketing plan, turning it loose and waiting for the results, companies can change their marketing allocation in real time, down to the minute if necessary.
Nichols calls his methods “Advertising Analytics 2.0,” and they represent an attempt to utilize the vast amounts of data and powerful technologies that exist today. For more information, read the story in the Harvard Business Review.